By, Dr. Ilya Gelfand, Research Associate, Kellogg Biological Station, Michgian
igelfand@msu.edu
When people ask me what I do, I need to stop for a moment to answer that for myself. What do I do? I have two types of answers: short and long. The short answer isn’t very short either, since ecosystem ecology requires additional explanation. First, an ecosystem is defined as a community of living organisms living and interacting within their environment. Ecosystem ecologists need to study both living and nonliving parts and their interaction, or to study biogeochemistry: interactions between biology and geology through chemical reactions. Therefore, I define myself as a biogeochemist. More specifically, I study the ecosystem ecology and biogeochemistry of partially degraded, heavily impacted ecosystems: agriculture. Given that 40% of Earth’s surface is used for agriculture, we need to understand the biogeochemistry of agricultural ecosystems if we want to understand how we are affecting the environment and adjust management to farm more sustainably.
Addressing the long answer to “what do I do” takes us into the world of greenhouse gases. Currently, my collaborators and I are developing a new method to study ecosystem-level nitrous oxide emissions from agricultural fields. Nitrous oxide (N2O) is a very important greenhouse gas as it is 300 times more potent than carbon dioxide (CO2). In the United States, agricultural soils are responsible for approximately 75% of N2O emissions. While intensively studied the last few decades, emissions of N2O from soils still puzzle scientists, mainly due to our limited ability to measure them with the current state of technology. Traditional approaches to measuring soil N2O emissions use so-called “static chambers”, bottomless buckets made out of plastic or metal that can be covered with a lid. The chamber is placed over soil in a field and after the lid is closed, three to five air samples are taken over one hour and analyzed for the concentration of N2O in the laboratory. This method is very simple, works in various weather conditions, and can be performed with minimal training. However, because we are limited by how many samples we can take per day and how many chambers we can deploy, our ability to interpret and scale-up results of these plot measurements is fairly limited.

A carbon dioxide eddy flux tower at one of the GLBRC / KBS LTER sites (Marshall Farm) measures the net amount of carbon dioxide captured by the ecosystem; Photo Credit: K.Stepnitz, Michigan State University KBS LTER
Today, with the development of small and energy efficient lasers we can start to think about ecosystem-level measurements that cover much more area than a typical research plot and take continuous samples. Such measurements are done routinely for CO2, using eddy-covariance towers. Each tower has a sensor to measure CO2 and water and a sensor that measures 3-dimensional wind direction, a technique that was developed to hunt German submarines during World War II and found its way to environmental research in the early 1980s. The sensors measure these variables with great precision at a very high speed (10Hz or 10 times per second), so in effect this method takes continuous measurements. By looking at the relationship between the speed and movement of individual parcels of air and the concentration of CO2 and water vapor, scientists can calculate how much water and CO2 is being transferred between the land surface and the atmosphere. This is very important as it tells us if a given field, for example no-till corn, is a net sink or source for CO2. With this kind of information we can determine which types of farm management are good for the climate (sinks of CO2) or are contributing to harmful climate change (sources of CO2).
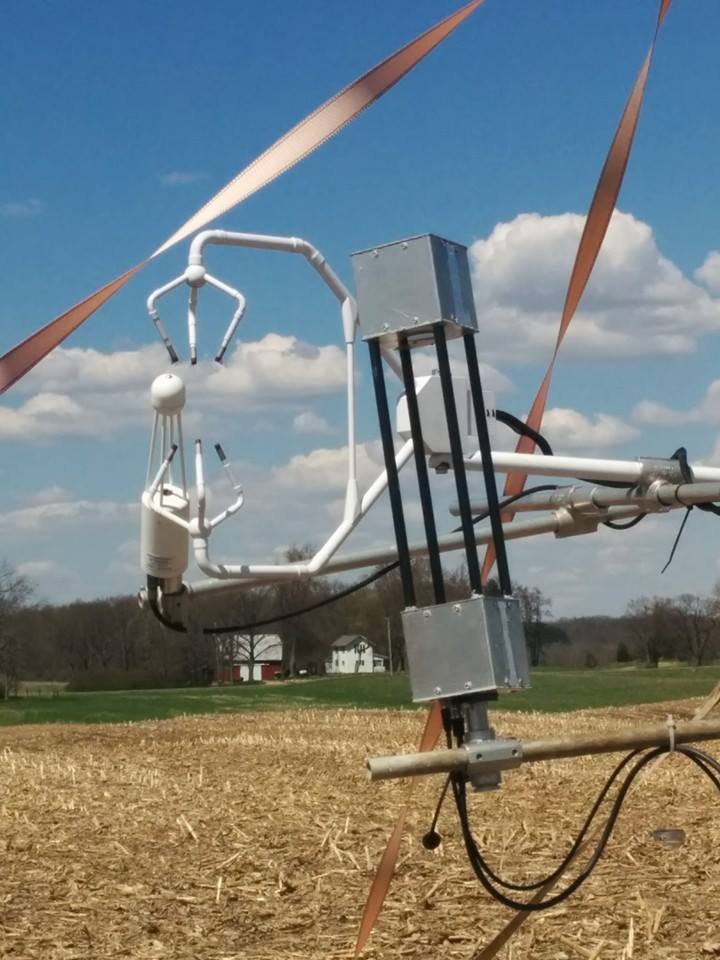
This sensor was added to the eddy-covariance tower in 2015 to measure nitrous oxide emissions.
With support from NSF EAGER and DOE GLBRC grants we are developing a similar approach for N2O. The development of such a new technique is challenging, but we have a great group of collaborators: Prof. Mark Zondlo and his students from Princeton University, Prof. Jiquan Chen from MSU, and the most important person, our own Mike Abraha at KBS who helps with his knowledge of eddy-covariance theory and practice. KBS LTER director Phil Robertson supervises this project.
This summer we acquired the first and very exciting results. With the help of Rick Moyer, an undergrad student in the KBS LTER Research Experience for Undergrads (REU) program, we were able to compare N2O emissions measured by the eddy-covariance tower with ground-based measurements by the static chambers. This allowed us to confirm the accuracy of the measurements taken by our new technique: we were able to measure what we want to measure, and therefore can use this new technique in the future. Second, we documented that N2O emissions have a diurnal pattern. That is, they peak during the afternoon and fall at night. This is very interesting and intriguing. Unlike CO2, nitrous oxide is not involved in photochemical reactions mediated by plants, and therefore its emissions pattern should not be affected by light. While the diurnality of soil N2O emissions had been observed by scientists before, it is not well understood or studied because of the lack of a simple and continuous measuring method.
The impact of developing this new method that enables continuous N2O measurements can’t be overemphasized. With such high frequency measurements we can start to understand the underlying processes of soil N2O emissions across large areas of land over long time frames. No longer will results be isolated to small plots and a few sampling time points. Our method, besides being continuous, is also not dependent on grid electricity as it is powered by solar panels. Therefore, this system can be set up in areas that previously were hard to study. These aspects of our method will allow scientists to calculate a global N2O budget, which is currently lacking. This will help policymakers, scientists, and land managers develop and implement farming practices that reduce N2O emissions and help slow the rate of harmful climate change.