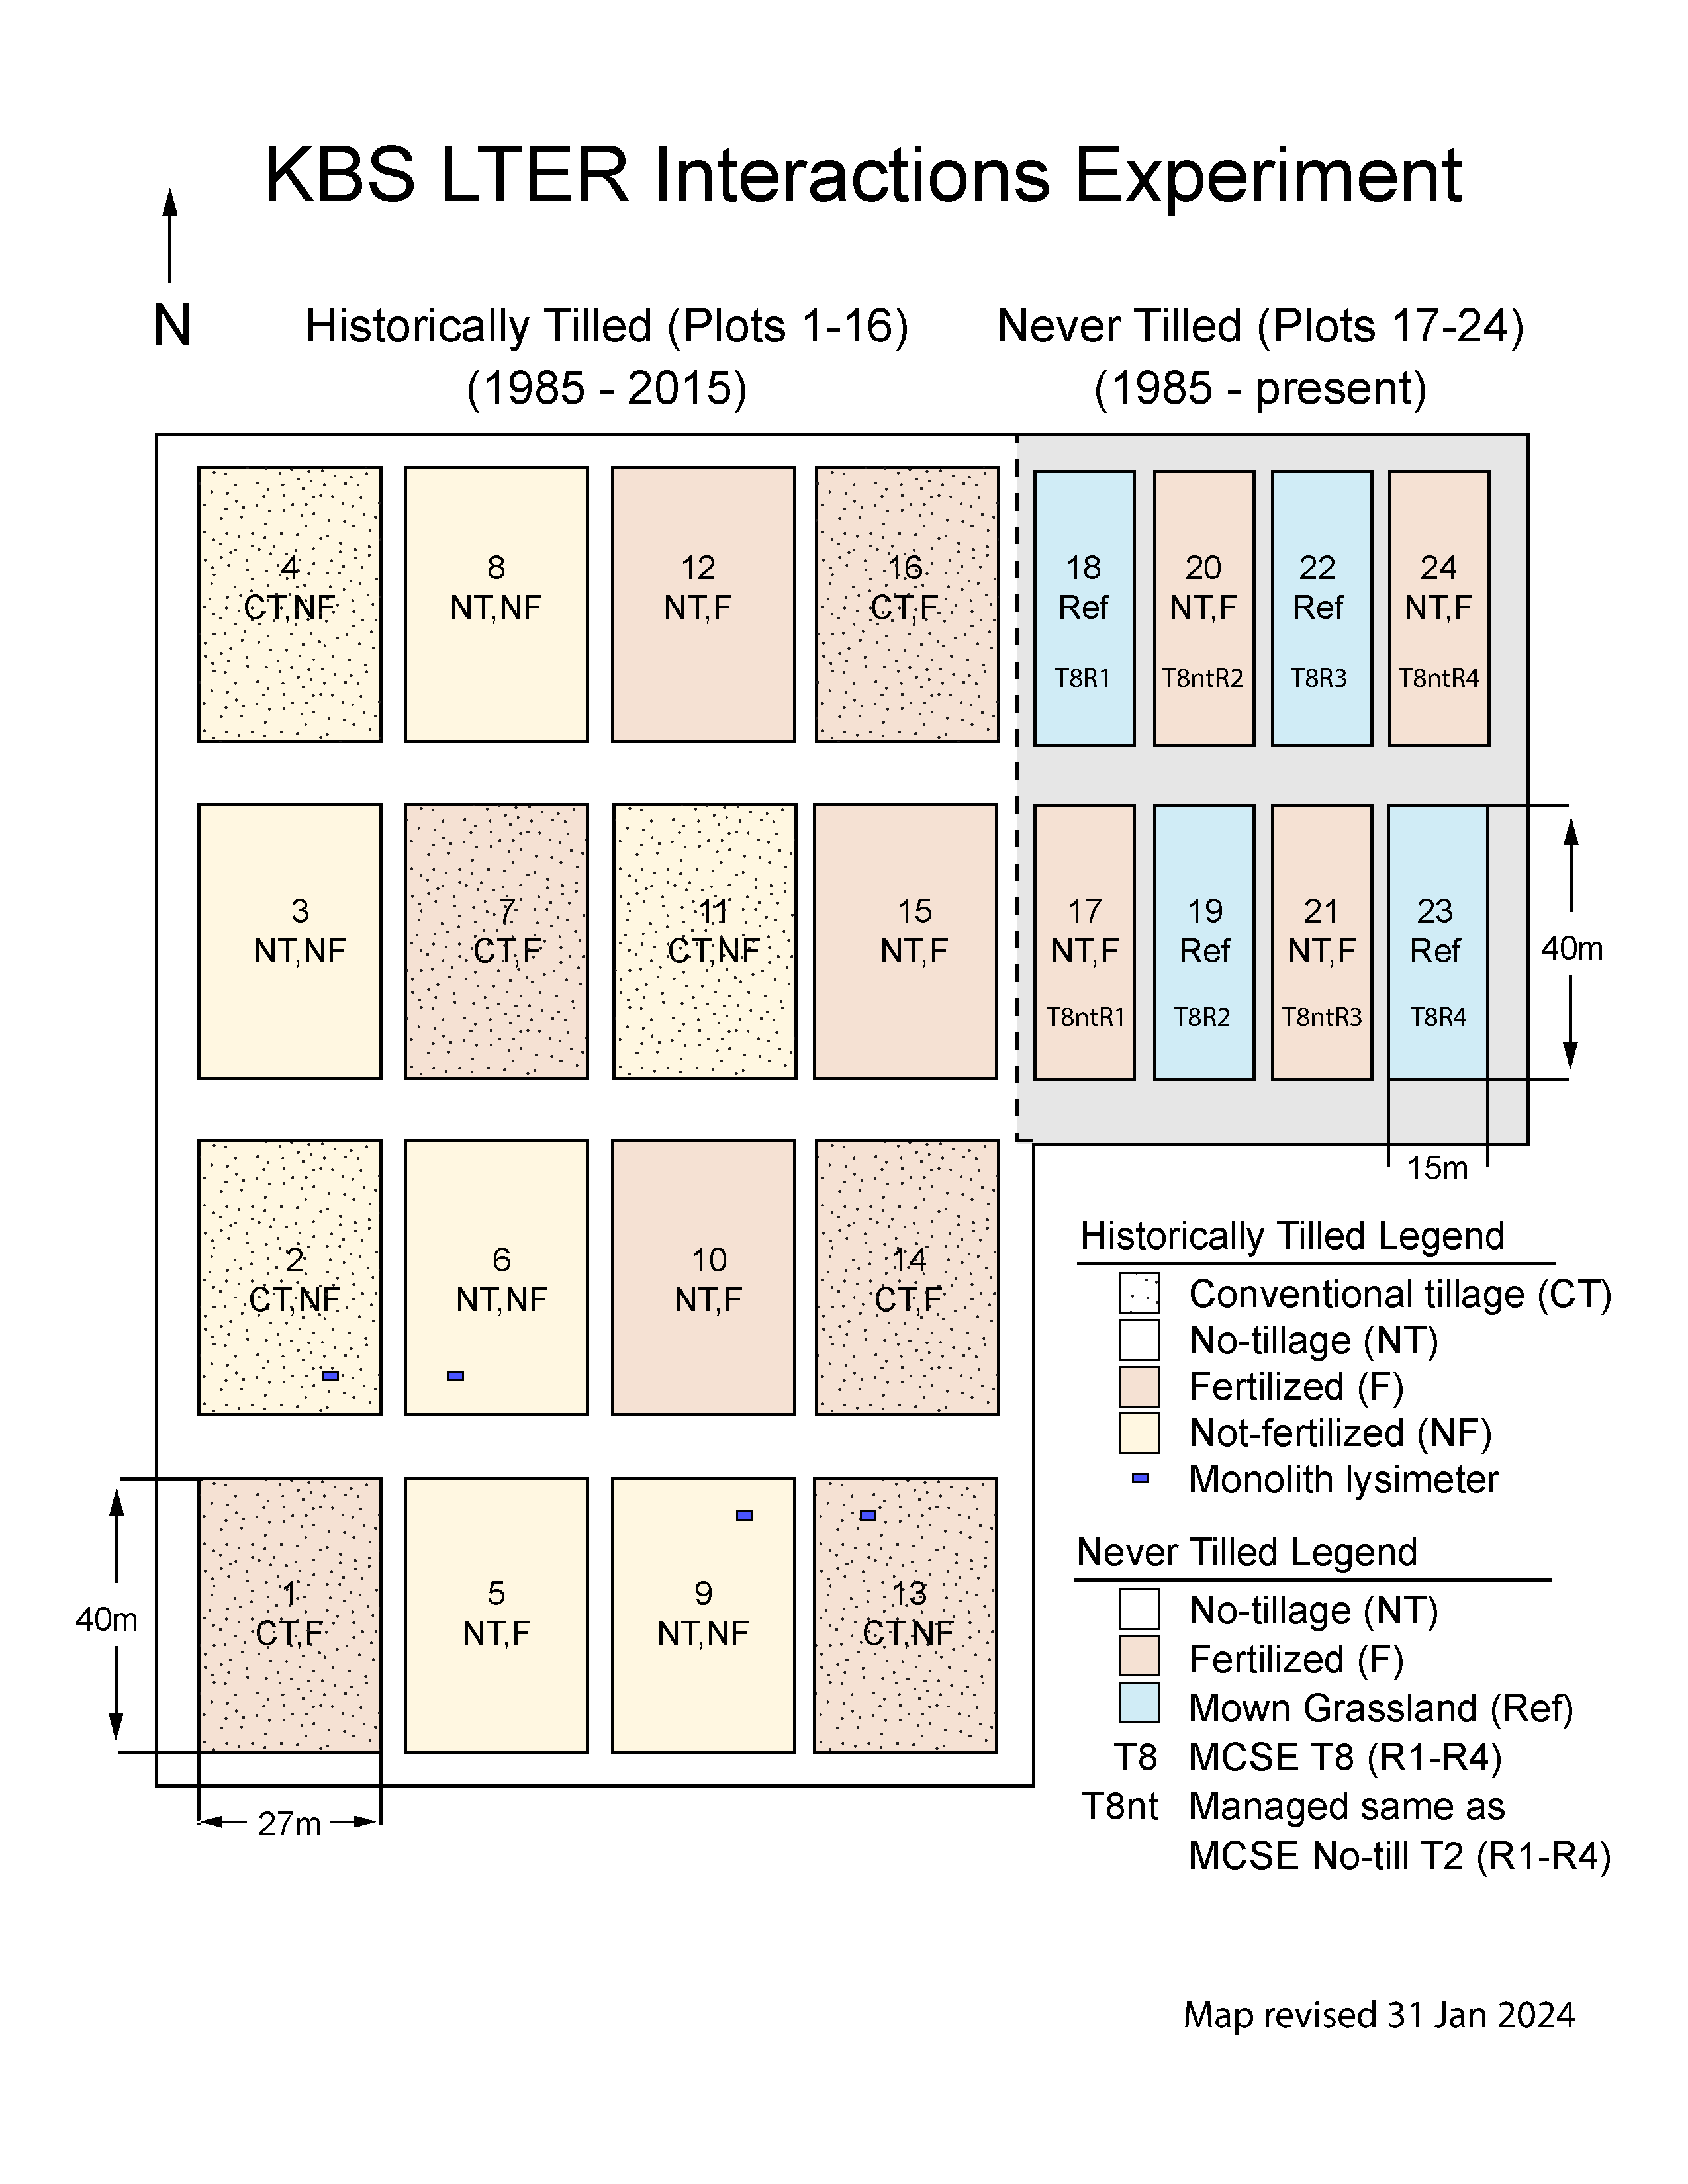
The KBS LTER Interactions Experiment was established in 1985 to provide an experimental context for examining interactions between tillage and fertilizer. The experimental site contains two areas that differed in prior land use history: one was historically tilled cropland and the other a never-tilled mown grassland (former forest, cleared ~1960). On the historical cropland, two tillage treatments (conventional and no tillage) were crossed in a full factorial design with two N fertilizer treatments (fertilized and not fertilized); each combination was replicated in four 27 x 40 m plots for a total of 16 plots planted initially to continuous corn. Ca. 2001 the experiment was aligned with the LTER Main Cropping System Experiment (MCSE) and planted to the same corn-soybean-wheat rotation. In spring 2016 all 16 plots were planted to switchgrass (Cave-in-rock) for the Switchgrass Nitrogen Fixation Experiment and this portion of the Interactions Experiment was retired.
On the never-tilled mown grassland, four 15 x 40 m no-till plots (T8nt; plots 17, 20, 21, and 24) were established and planted to the same crop as in the historically tilled portion of the site, but rather than being converted to switchgrass in 2015 they continue to follow the MCSE crop rotation, with management similar to the MCSE No-till (T2) treatment. Four other plots (plots 18, 19, 22, and 23) serve as a Never-tilled Mown Grassland treatment (T8) for the MCSE, providing a reference site for an undisturbed and uncropped soil profile. The T8 mown grassland plots have been mown annually in the fall to inhibit tree growth since the site was deforested ca. 1960; mown biomass is left in place.
Four in-ground monolith lysimeters (each 1.2 m x 2.2 m x 2.2 m deep) were installed in 1990 in historical cropland plots and remain intact: one lysimeter is located in 2 replicate plots initially with no tillage, no N fertilizer (plots 6 and 9) and 2 replicate plots with conventional tillage, no N fertilizer (plots 2 and 13).
Maps:
Information:
- Publications
- Data (search under Other Experiments)